
Setting up Simple Monitoring and Logging Infrastructure
While creating a simple monolith application , we had this challenge of setting up monitoring and logging on all the involved systems…

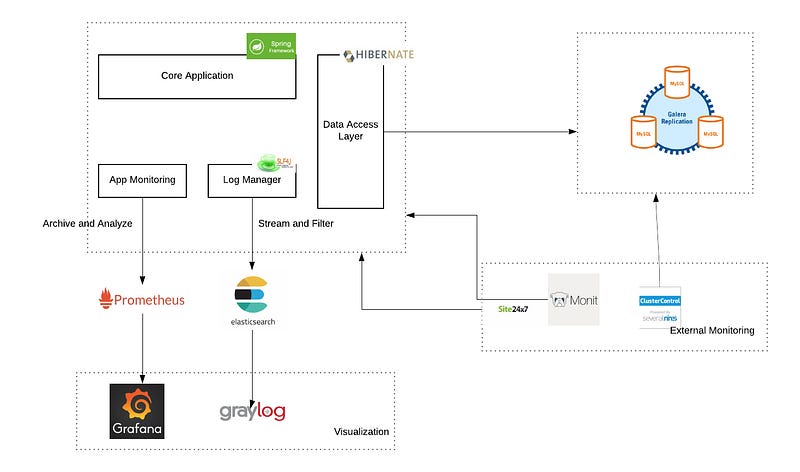
While creating a simple monolith application , we had this challenge of setting up monitoring and logging on all the involved systems. Finally we zeroed in on a simple architecture that requires only a few hours to setup and is cloud agnostic.
We used this to monitor an application which had more than 100k MAV.
The frontend and backend applications use monitoring at various levels to monitor both Server and Application Status at all times :
Process Manager
Supervisord for Backend Java Applications
PM2 for Node.Js front end applications
Application Stats
Spring Boot Actuator for Application Health Stats and Metrics for Java Applications.
All the above stats from each server are sent to a Prometheus Server which allows us to
Integrate and visualize metrics from multiple sources in a single UI
Allows querying of collected data
Setup alerts based on specific state of collected data.
External Uptime Check
The system is monitored by an external service for Uptime. This guarantees we are alerted if the whole system is compromised. For this we use Site 24x7 .You can also use Pingdom or any other service
Logging
For centralized log management we use Graylog. Built to open standards, Graylog’s connectivity and interoperability seamlessly collects, enhances, stores, and analyzes log data.